Decision Mechanics

Insight. Applied.

  • Services
    • Decision analysis
    • Big data analysis
    • Software development
  • Articles
  • Blog
  • Privacy
  • Hire us

Tufte in R

April 21, 2016 By editor

minimal line plot using ggplot2

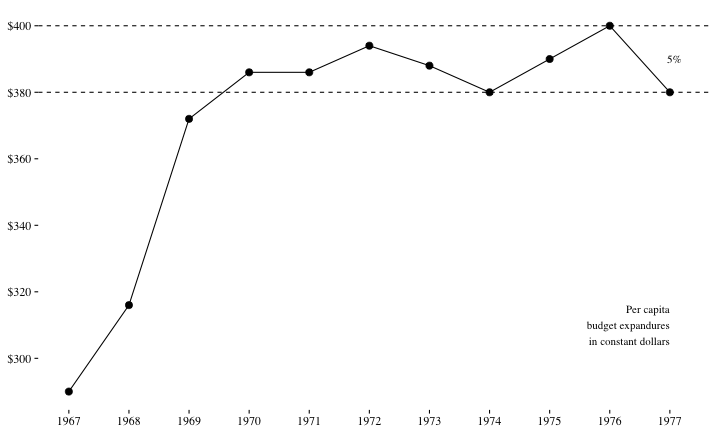
Lukasz Piwek maintains a resource that shows how the visualization practices developed by Edward Tufte can be replicated in R.

His neat Tufte in R site currently contains examples of the following visualizations

  • minimal line plot
  • range-frame (or quartile-frame) scatterplot
  • dot-dash (or rug) scatterplot
  • minimal boxplot
  • minimal barchart
  • slopegraph
  • sparklines
  • stem-and-leaf display

It’s a living resource, so he’s adding to the collection over time.

Example code is given for R base graphics, lattice and ggplot2.

Print Friendly, PDF & Email

Share this:

  • Email
  • Twitter
  • LinkedIn
  • Facebook

Filed Under: Data analysis, Data science Tagged With: chart, ggplot2, lattice, R, R base graphics, Tufte, visualization

Search

Subscribe to blog via e-mail

Subscribe via RSS

Recent posts

  • Data Wrangler
  • The Trolley Problem
  • Counting votes using Excel
  • Accuracy vs precision
  • It’s not because we have insufficient data…

Copyright © 2025 · Decision Mechanics Limited · info@decisionmechanics.com