Decision Mechanics

Insight. Applied.

  • Services
    • Decision analysis
    • Big data analysis
    • Software development
  • Articles
  • Blog
  • Privacy
  • Hire us

Visual Vocabulary tool

January 4, 2018 By editor

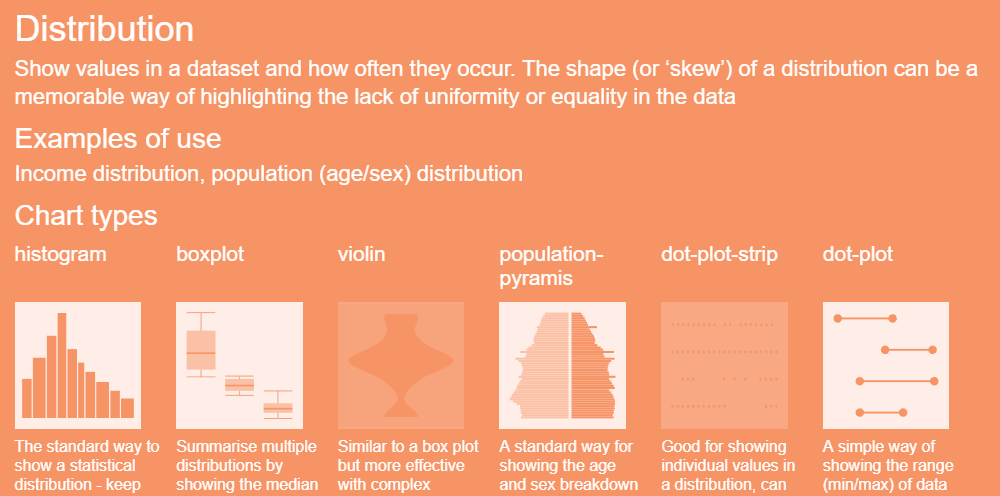
Financial Times Visual Vocabulary tool

Choosing the right type of chart is an essential part of producing an effective data visualization. It’s pointless adding bells and whistles to something that’s fundamentally unsuited to the
message you are trying to convey.

The Financial Times Visual Journalism team have a Visual Vocabulary tool that helps them choose the correct chart for a story. It’s basically a catalog of charts indexed by the following data relationships

  • Deviation
  • Correlation
  • Change over time
  • Ranking
  • Distribution
  • Part to whole
  • Magnitude
  • Spatial
  • Flow

There’s also a PDF poster available.

Filed Under: Data science Tagged With: visualization

Data organization in spreadsheets

November 16, 2017 By editor

Karl Broman and Kara Woo offer some good advice on organizing data in spreadsheets.

They advocate confining the use of spreadsheets to data entry and storage—moving calculations and visualizations to other tools. This certainly avoids some of the biggest problems with using spreadsheets.

However, spreadsheets don’t enforce any discipline. It’s up to the user to be vigilant and do the right thing. People are bad at maintaining consistency. Computers are excellent at it. Why make it hard for ourselves?

Spreadsheets. Just say no.

Filed Under: Data analysis, Data science Tagged With: spreadsheets

Do you really need machine learning?

May 10, 2017 By editor

I have a lot of sympathy for the view expressed in the following tweet

Good CS expert says: Most firms that thinks they want advanced AI/ML really just need linear regression on cleaned-up data.

— robin hanson (@robinhanson) November 28, 2016

Many organizations who dive into machine learning haven’t even started to extract value from their data.

I understand why they want to get on the train. If you’ve not managed to draw value from your data yet why not just shovel it all into these amazing algorithms and let insights flow out the other end. Jump to the latest technology. Makes sense.

Unfortunately that’s not how data science works. The success of any data science project depends on you understanding your business and your data.

Some things you might do before adopting machine learning

  • Work out what data you need to help you manage and improve your business
  • Introduce your managers to your data people
  • Clean and curate your data
  • Put systems in place that give you real-time access to useful simple statistics—averages, totals, trends, etc.
  • Use simple statistical tools—like linear regression—to get deeper insights
  • Make use of decision science techniques (e.g. game theory)—not everything is amenable to running masses of data through algorithms

If you’re ready for it, machine learning is fantastic. However, if you deploy it as a magic bullet, don’t be surprised when you shoot yourself in the head.

Filed Under: Data science, Machine learning

UK’s National Health Service loses data—old skool

March 2, 2017 By editor

Over half a million UK National Health Service (NHS) records went missing between 2011 and 2016.

When I first skimmed the headline, I was thinking “Another data breach…[yawn].” But, turns out it was all paper. 500,000 paper records went missing.

A private mail direction company sent the records to a warehouse. They had either been incorrectly addressed or the associated patients had moved surgery. Unfortunately, the records—including test results for serious illnesses—were abandoned at that point.

A review is underway to decide whether any patients died due to the missing documents.

You can see how databases are overlooked—the information is pretty abstract. But, a mountain of 708,000 documents (there were administrative documents as well)?! Who walked by that every day without asking questions?

Filed Under: Data science Tagged With: health, loss, NHS, patient records

Personal rating dystopias

February 16, 2017 By editor

Black Mirror’s “Nosedive” episode portrays a future society, frighteningly like our own, in which people rate each other as a consequence of all kinds of trivial social interactions. Your overall rating is public and determines your job prospects, housing options, social invitations, etc—causing people to obsess over improving them.

As in most public policy decisions you control behavior by tweaking the incentives.

This terrifies me—because I can see it happening. I’ve since been informed that Uber pretty much operates along similar lines.

Now, it has to be said, I’m not a huge fan of social media. And, I’ve railed against the pointless tyranny of personal ratings in the past. To say the least, the world portrayed in the show isn’t my kind of thing.

So, imagine my horror to read in the Wall Street Journal that

Beijing wants to give every citizen a score based on behavior such as spending habits, turnstile violations and filial piety, which can blacklist citizens from loans, jobs, air travel

My concern is that we know that data science is a bit of an art form. False positives appear all the time when profiling potential terrorists. Recommendation systems run the gamut from bloody obvious to downright bizarre. Many corporations can’t begin to make sense of their own data lakes. Basically, it’s a work in progress.

Yet, here we are…on the verge of disenfranchising people on the basis of scores that, I can guarantee you, will be fundamentally flawed.

Filed Under: Big data, Data analysis, Data science Tagged With: Black Mirror, idiosyncratic rater effect, Nosedive, personal ratings, ratings

  • « Previous Page
  • 1
  • …
  • 7
  • 8
  • 9
  • 10
  • 11
  • …
  • 18
  • Next Page »

Copyright © 2026 · Decision Mechanics Limited · info@decisionmechanics.com