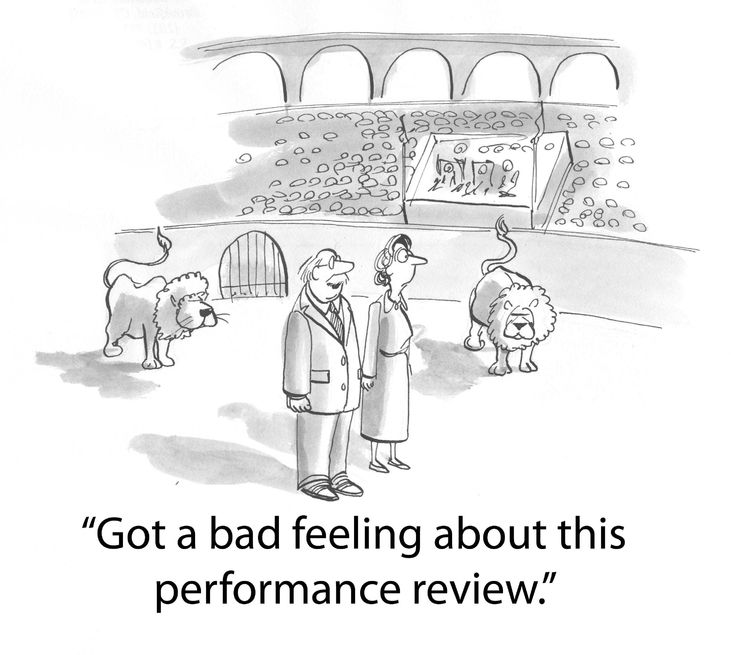
A colleague of mine cautions that performance ratings say more about the marriage of the person doing the assessing than the performance of the person being assessed.
Turns out she may have a point.
Most people have some experience with performance appraisals. Maybe as part of an annual salary review. Or even just completing a customer satisfaction survey. It’s become a pretty ubiquitous process over the past decade or so.
Unfortunately it’s process that is flawed. Deeply flawed.
It turns out that we’re really bad at rating others. In fact, we’re so bad at it that someone has given the phenomenon a name—the Idiosyncratic Rater Effect.
And it’s well documented.
It was first shown in a study from 1998, published in Personnel Psychology. This was followed by a 2000 paper in the Journal of Applied Psychology. Then, in 2010, the results were confirmed by yet another paper in Personnel Psychology.
Each study found that the idiosyncrasies of the person doing the rating accounted for over half of the variations in ratings. The three studies put the number at 71%, 58% and 55%, respectively.
No other factor accounted for more than 20% of the score.
As performance management expert Marcus Buckingham put it in an interview
Most of what is being measured is the unique rating tendency of the rater. Thus ratings always reveal more about the rater than they do about the ratee.
Later in the same interview he highlighted the data quality problem facing organizations who rely on these flawed assessments, saying
We all need to grapple with that problem [the Idiosyncratic Rater Effect] as we move into the big data world of the future. We need to figure out how we put good data in.
Once this data ends up in the system, it’s sliced, diced and combined with other data to produce a range of derivative conclusions…all based on a false premise—i.e. that one person is able to effectively judge the performance of another.
There has been some suggestion that the Idiosyncratic Rater Effect can be minimized by averaging across many assessments. But this, amongst other things, assumes that the idiosyncrasies exhibited by raters are independent. That’s a big assumption.
Research on the Idiosyncratic Rater Effect has largely focused on HR. However, the same problems plague customer satisfaction surveys. Developers of iPhone apps have long suffered the vagaries of the App Store review process, for example. In what turns out to be a brutal demonstration of the Idiosyncratic Rater Effect a number of leading iOS app developers made a hilarious video of themselves reading one-star reviews received by their apps.
Business consultant and author Frederick Reichheld has argued for customer feedback to be boiled down to one question—or “The Ultimate Question” as he calls it in his book of the same name. This question is
How likely is it that you would recommend us to a friend or colleague?
In his research, satisfaction scores for this question, when compared with those for other questions, consistently showed the strongest correlation with repeat purchases or referrals.
Amazon is the latest company to say it will overhaul its controversial performance assessment rating system. This follows shake-ups at major organizations such as Goldman Sachs, the Pentagon, IBM and GE. Accenture has ditched ratings altogether.
Others have argued in defense of performance evaluations—looking at ways to “minimize” bias. This strikes me as an attempt to push on with something that is fundamentally flawed because no-one has a better solution.
We need to focus on linking individual performance directly and transparently to well-defined organizational goals. This isn’t easy. It’s been problematic when attempted in the US school system. But, if performance-related management is going to work, and gain credibility, it’s going to need a radical overhaul.


